
At Wavelength we tend to work with brands who want to differentiate through experiences. These organisations tend to underestimate the role employees play in delivering such experiences via the brand values, essence, promise and positioning.
When it comes to brand positioning employees and segments’ perceptions frequently differ. This problem is usually compounded by positive self-referencing. “We’re customer focused, innovative, responsive” etc. Sound familiar?
An earlier post outlined how we use advanced statistics to help clients objectively understand their brand positioning. This can be taken one step further by using such techniques to understand how aligned brand positioning perceptions are across different stakeholder groups.
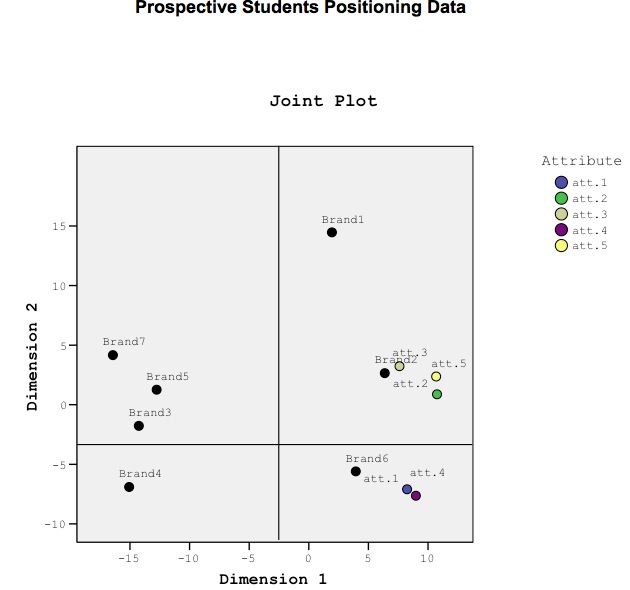
Below provides an example of a Wavelength client from the educational sector that suffered from brand positioning alignment issues. The first chart shows employees’ perceptions, the second current students and the third prospective students. Black dots indicate the brand. Colour dots indicate the brand association. Our client was Brand 1.


So what did three charts show?
- Misconceptions. Our clients’ employees (Brand 1) believed they were student focused (4) and vocational (5). Good times. Not really. The second and third charts paint a different picture…
- Misalignment. Brand positioning perceptions differed amongst employees and the two students segments for the i) brands i.e. black dots or ii) associations connected with those brands i.e. the coloured dots
- Anonymity. Current students didn’t think our client was student focused (4) or vocational (5). They actually didn’t associate our client with much. It lacked distinction. A floater. Bad times.
- Fuzziness. Prospective students held no strong brand associations with regards to most brands. Brands 2 and 6 were the only exceptions. The prospective target segment positioning picture was pretty bleak. Our client (Brand 1) was now in the abyss. Brand positioning work clearly work needed to be done.
So how can brand strategists use such insight?
- Measure alignment. If stakeholder perceptions are not aligned using the above can provide an objective basis for remedial action.
- Benchmark performance: Such techniques can be used to monitor brand positioning vis-à-vis a brand’s competitors across stakeholders across segments, stakeholders etc.
- Engage employees: Most organisations forget to measure employees’ brand perceptions. This is a fatal mistake because great brands are built from within. Engaging employees in the branding process is always a wise move and this entails obtaining their views. Their perceptions may need to be ‘calibrated’, as was the case above.
- Educate employees. It’s important employees understand current and desired brand positioning (on the assumption they’re different). This will help them appreciate the role they play in positioning the brand. Simple but objective perceptual maps help anchor and focus brand positioning objectives in employees’ minds.
- Internal marketing. Researchers can drill down into the data and identify brand positioning perceptions by function, country or even location. This can once more provide the basis for internal brand engagement and education programmes that address potential misalignment.
Using such techniques is a far cry from subjective perceptual maps that are open to debate and criticism. The above outlines how statistical techniques can be used to reduce risk, clarify brand insight and help focus brand marketing resources. More importantly they play an important role in aligning brand perceptions. There’s no harm in that.
Do you have any examples of how statistics have been used to facilitate brand strategy? If so, we’d love to hear from you.